Latest Reports
Masih pada pembahasan sebelumnya Update terbaru MSCI tetap membekukan penilaian indeks sementara sampai bulan Mei-Juni 2026 dan badnews muncul dari kondisi perekonomian terutama pergerakan USD-IDR indonesia sempat menyentuh 17.300 per dollar pada penutupan perdagangan jumat 24 april 2026 dan downgrade outlook fitch untuk 4 big bank Indonesia.
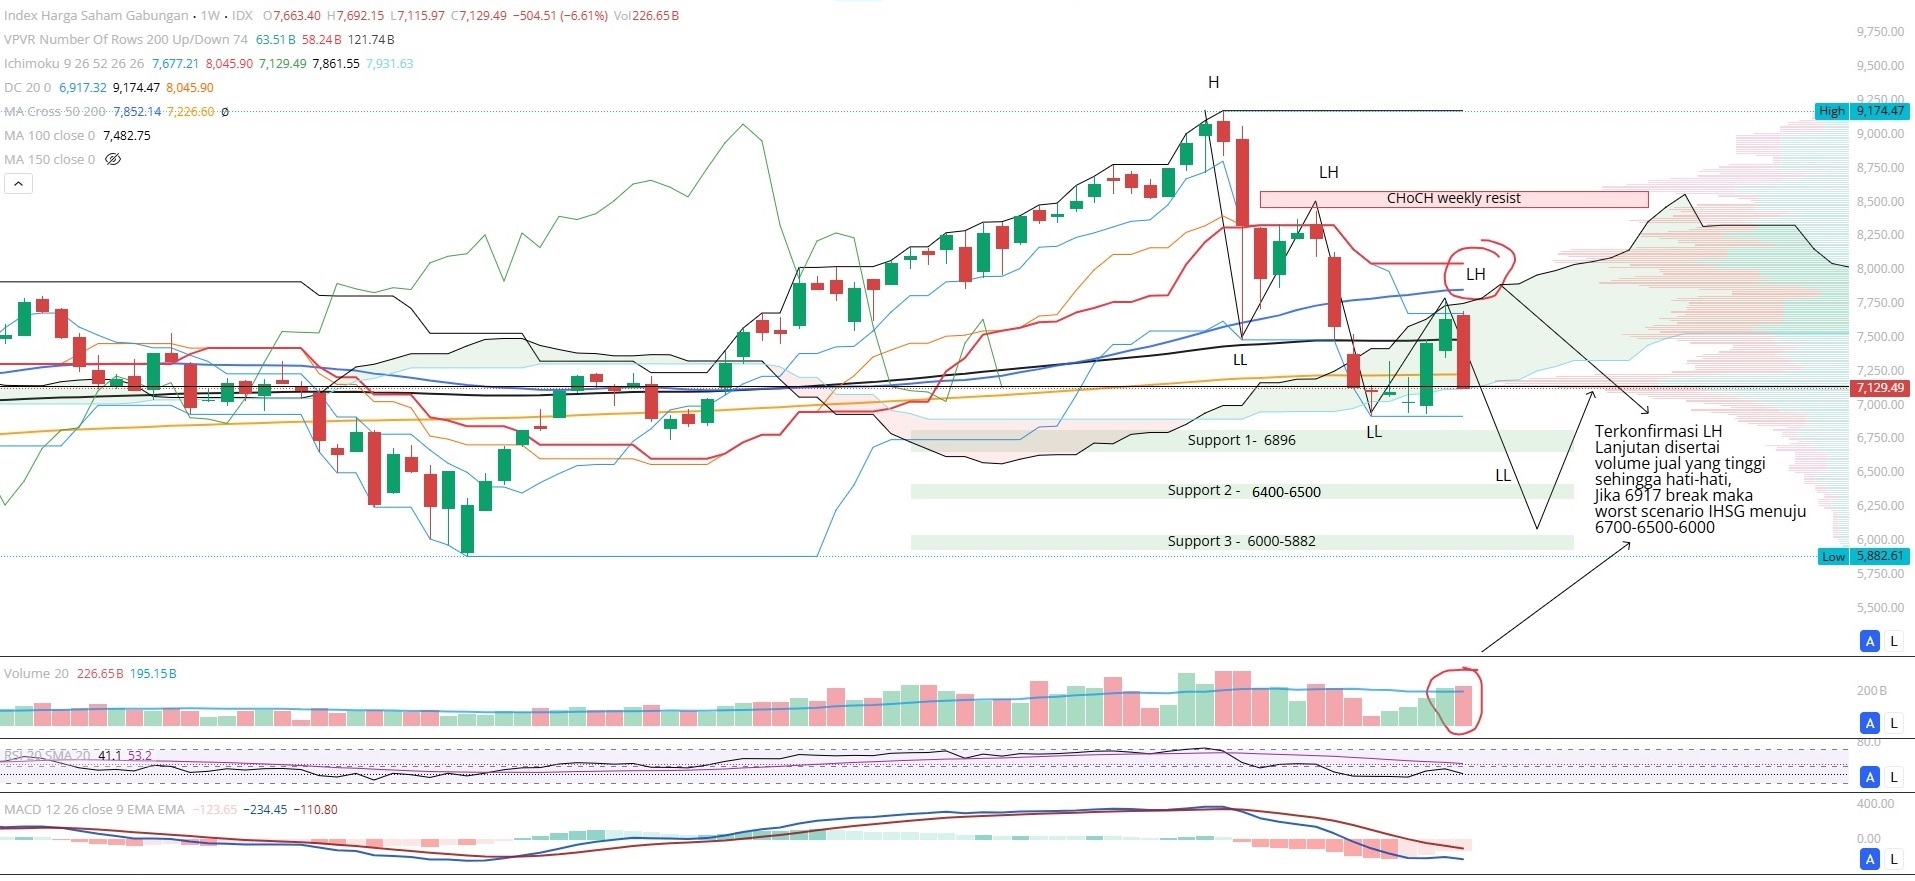
Pada penutupan mingguan per 26 april 2026 IHSG mengalami penurunan diperkuat dengan volume jual mingguan yang cukup besar
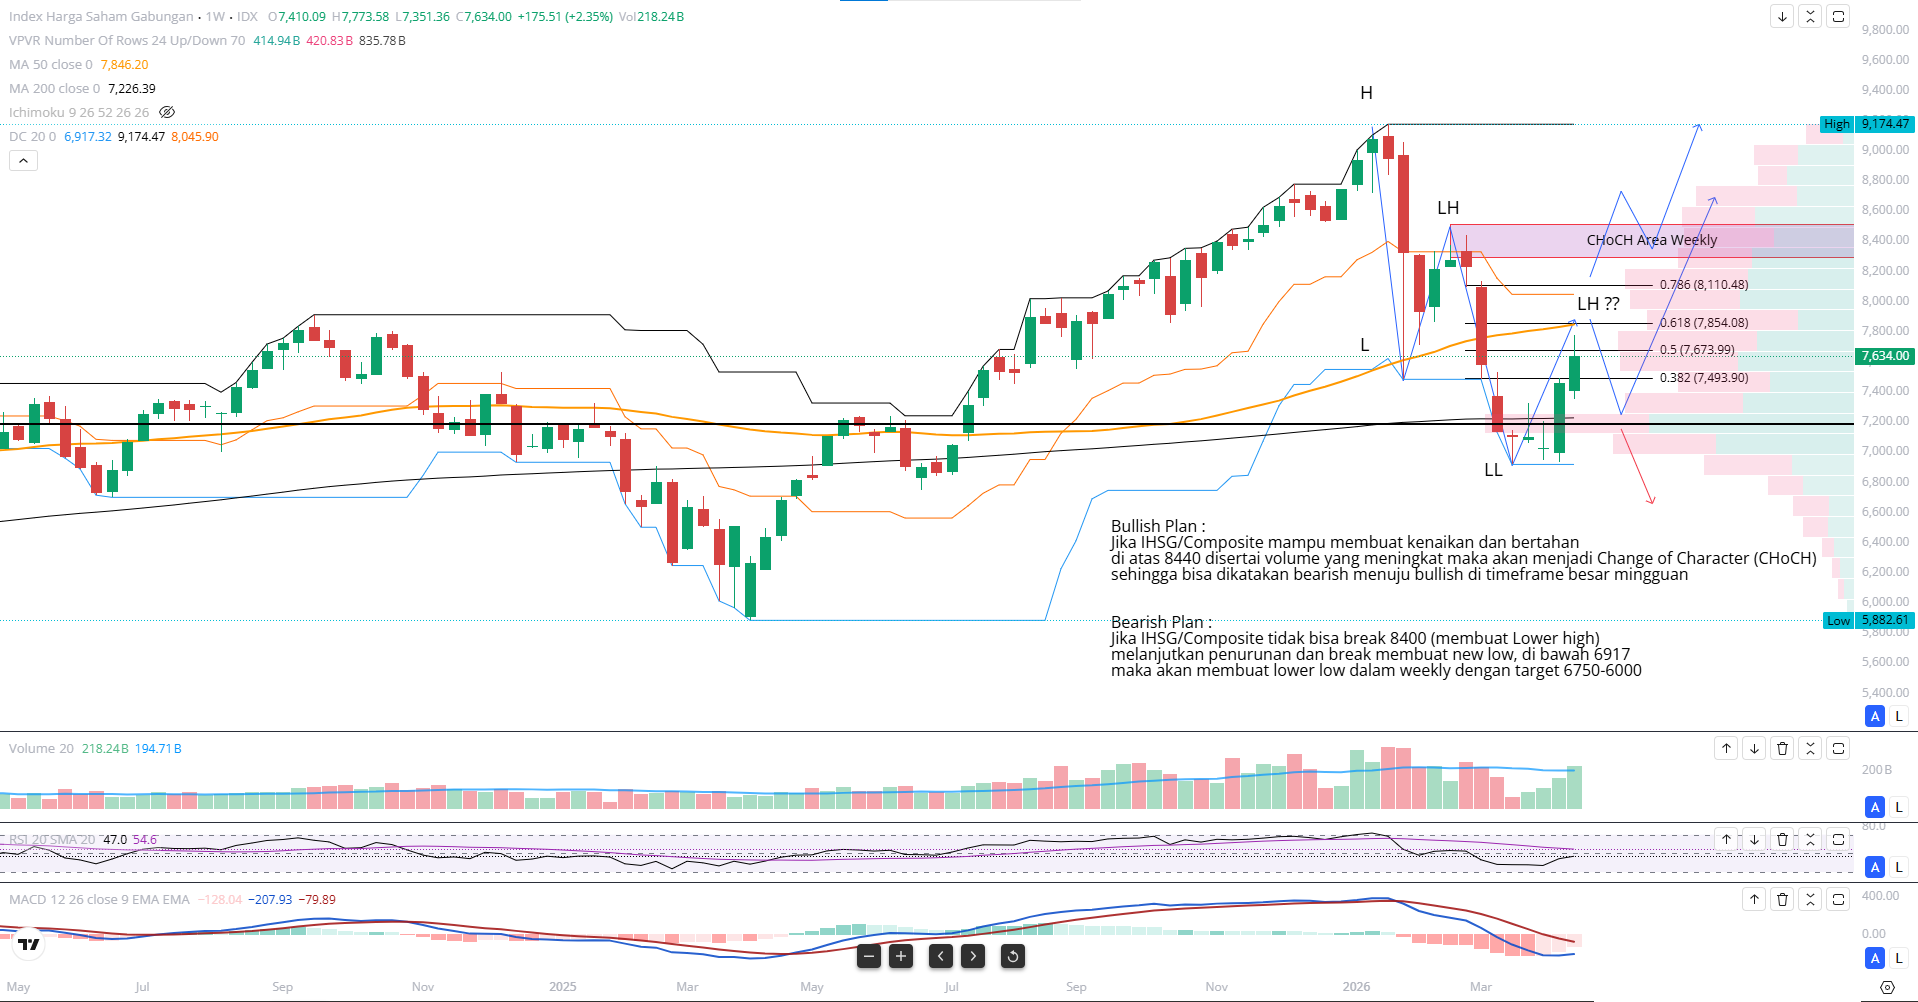
Jika diliat dalam chart weekly diatas IHSG/Composite membuat LH (Lower High) dan langsung melanjutkan penurunan disertai volume jual besar dengan candle bearish Engulfing, penutupan weekly selanjutnya tgl 28 april - 1 mei 2026 sangat menentukan apakah IHSG menutup gap 7022 kemudian rebound atau weekly break 6917 dan membuat new Lower low divalidasi dengan candle bearish selanjutnya
Perlu diperhatikan untuk timeframe weekly/mingguan, IHSG masih berada pada fase Bearish sampai break CHoCH 8440++ untuk konfirmasi bullish jangka panjang.
Ketika Change of Character terjadi (8400++ berhasil ditembus dan bertahan) maka akan valid dikatakan bahwa IHSG ready to uptrend / bullish dalam jangka panjang.
Plan 1 Composite : Bullish (Daily)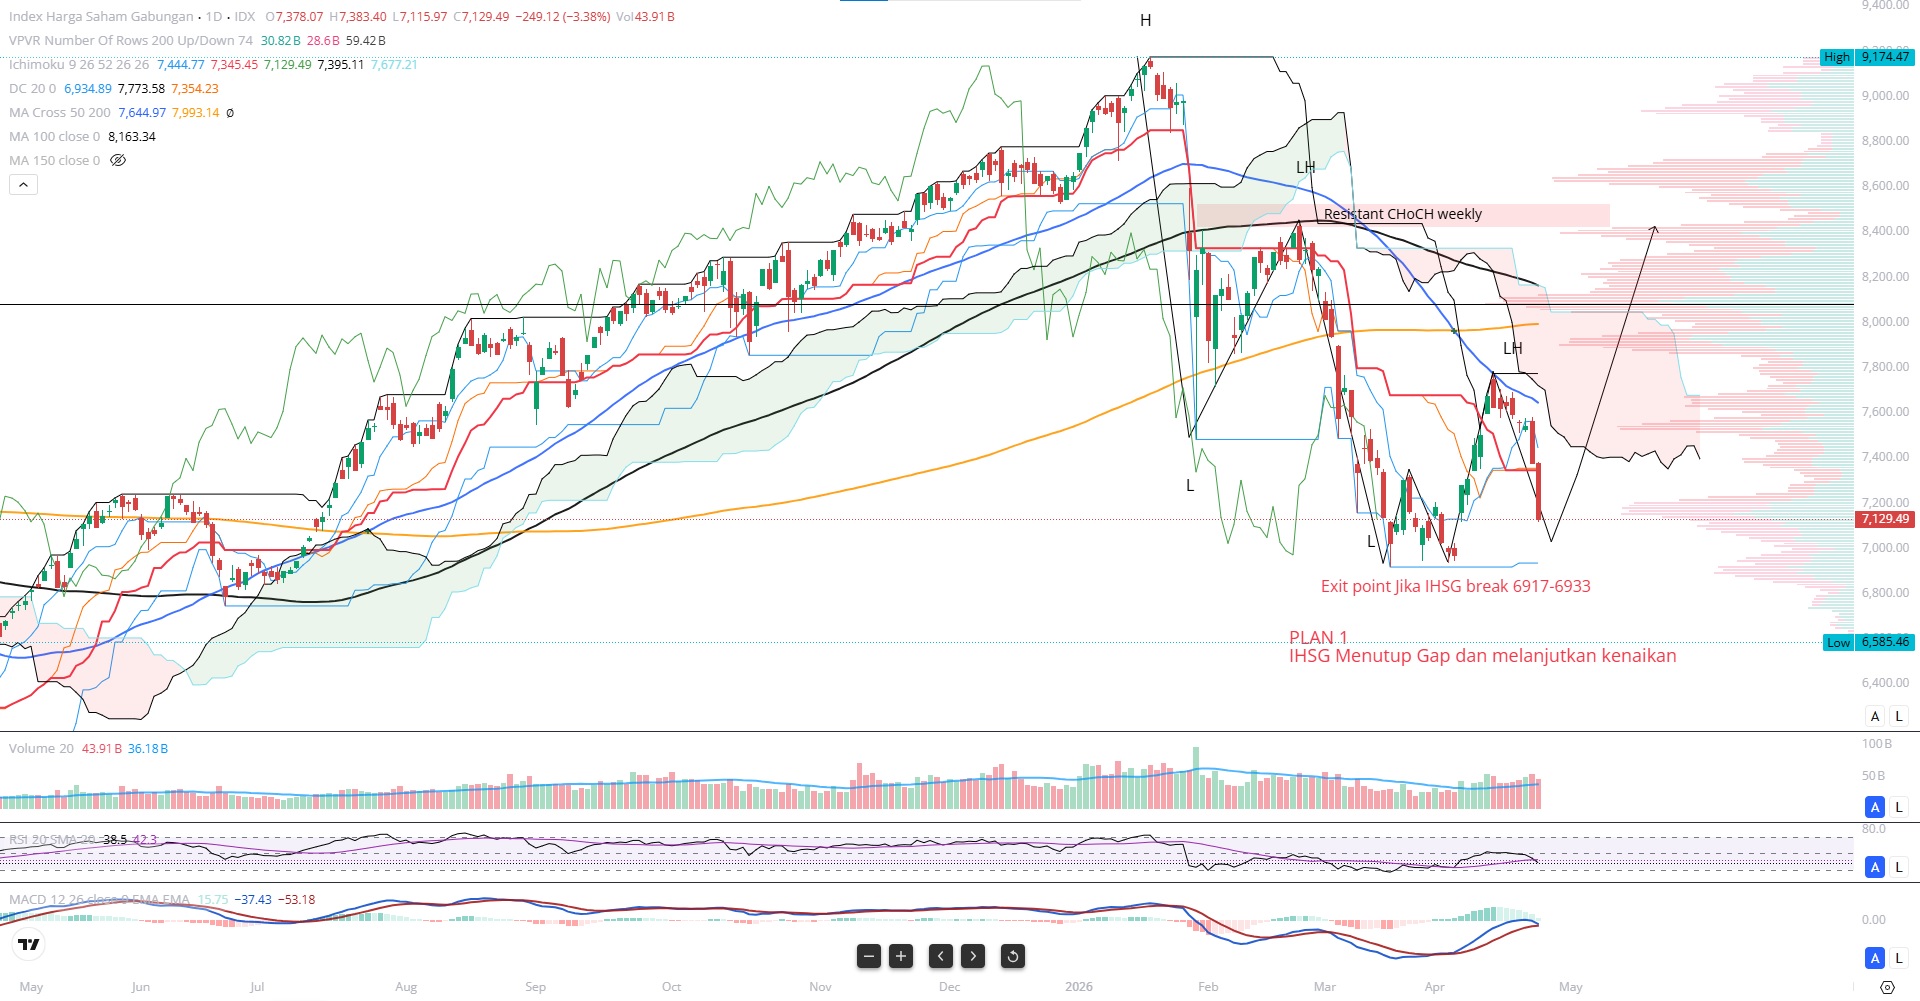
Plan 1 Untuk timeframe daily IHSG/Composite index dikatakan bullish jika menutup gap 7022 dan rebound untuk melanjutkan kenaikan
Stoploss/Exit : 6917 (Exit jika ihsg break dibawah 6917)
Plan 2 Composite : Bearish HnS (Daily)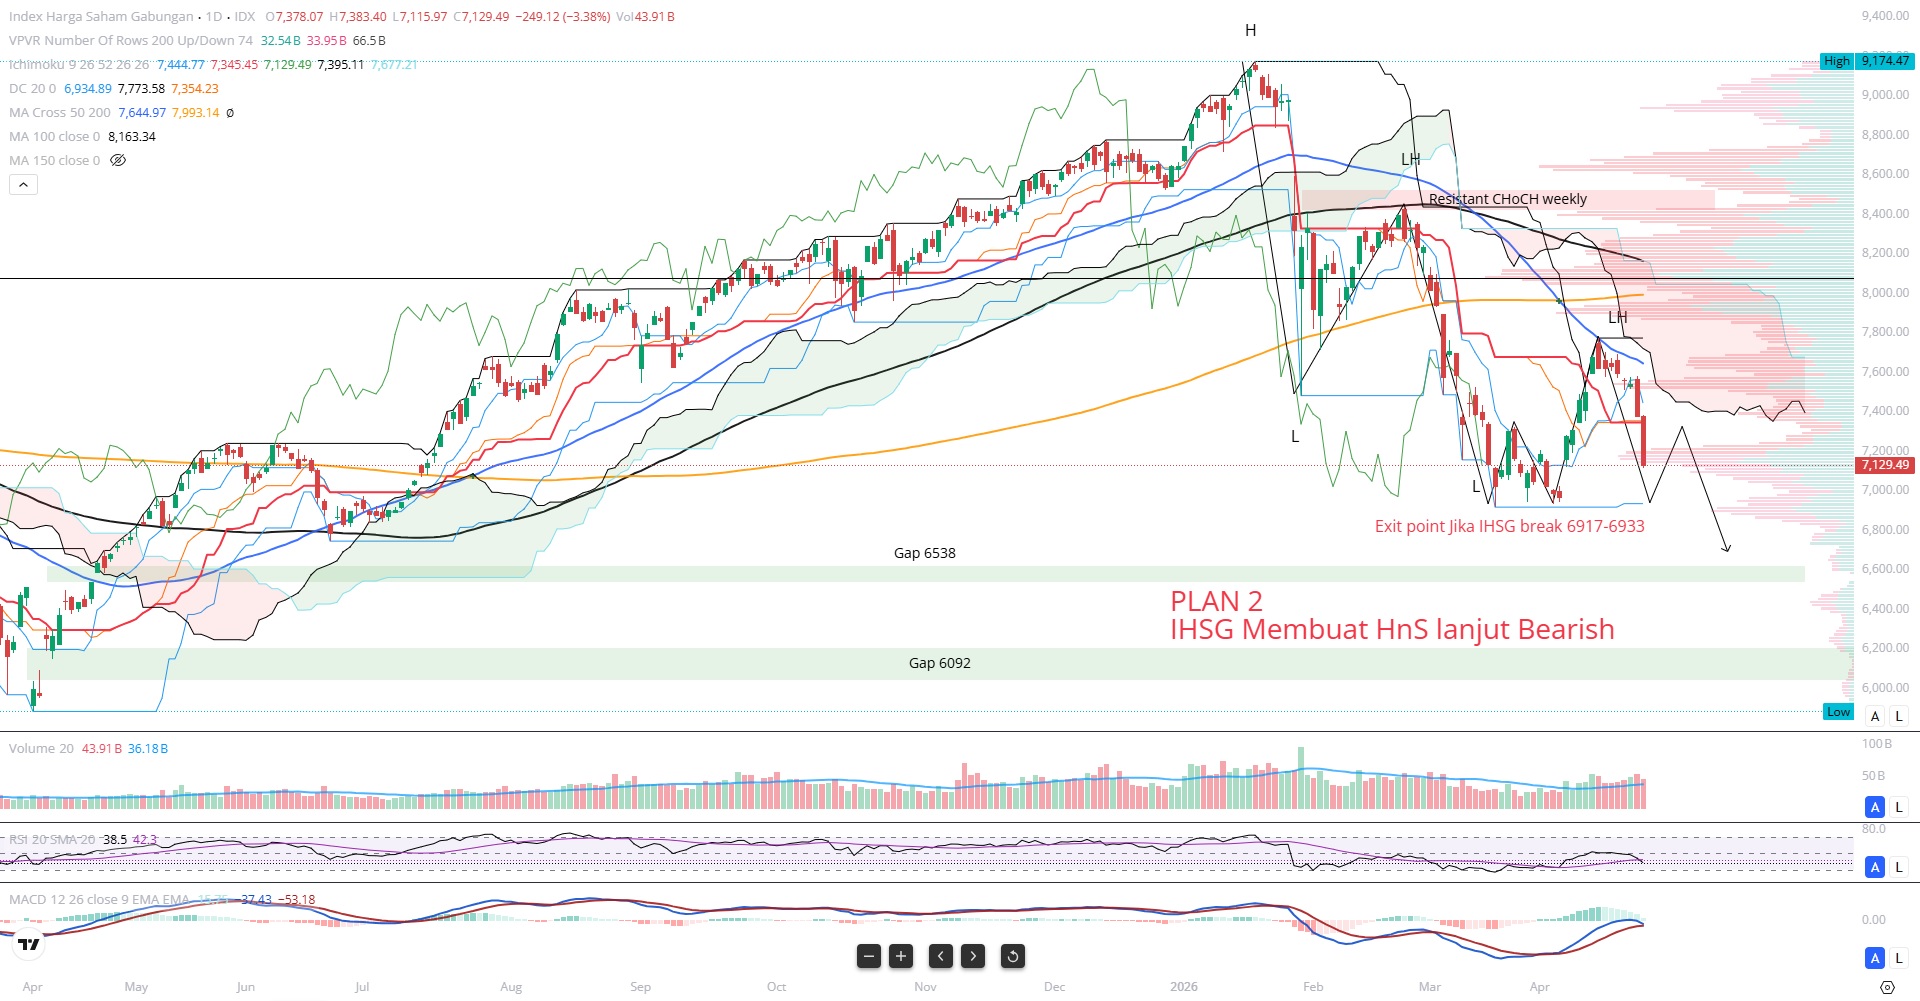
Plan 2 Untuk timeframe daily IHSG/Composite index membentuk Head n Shoulder/ HnS (Fast trade namun high risk)
Entry : 6930-6950
Sell : 7300
Stoploss : 6917 (Exit trade jika break dibawah 6917 )
Plan 3 Composite : Bearish (Daily)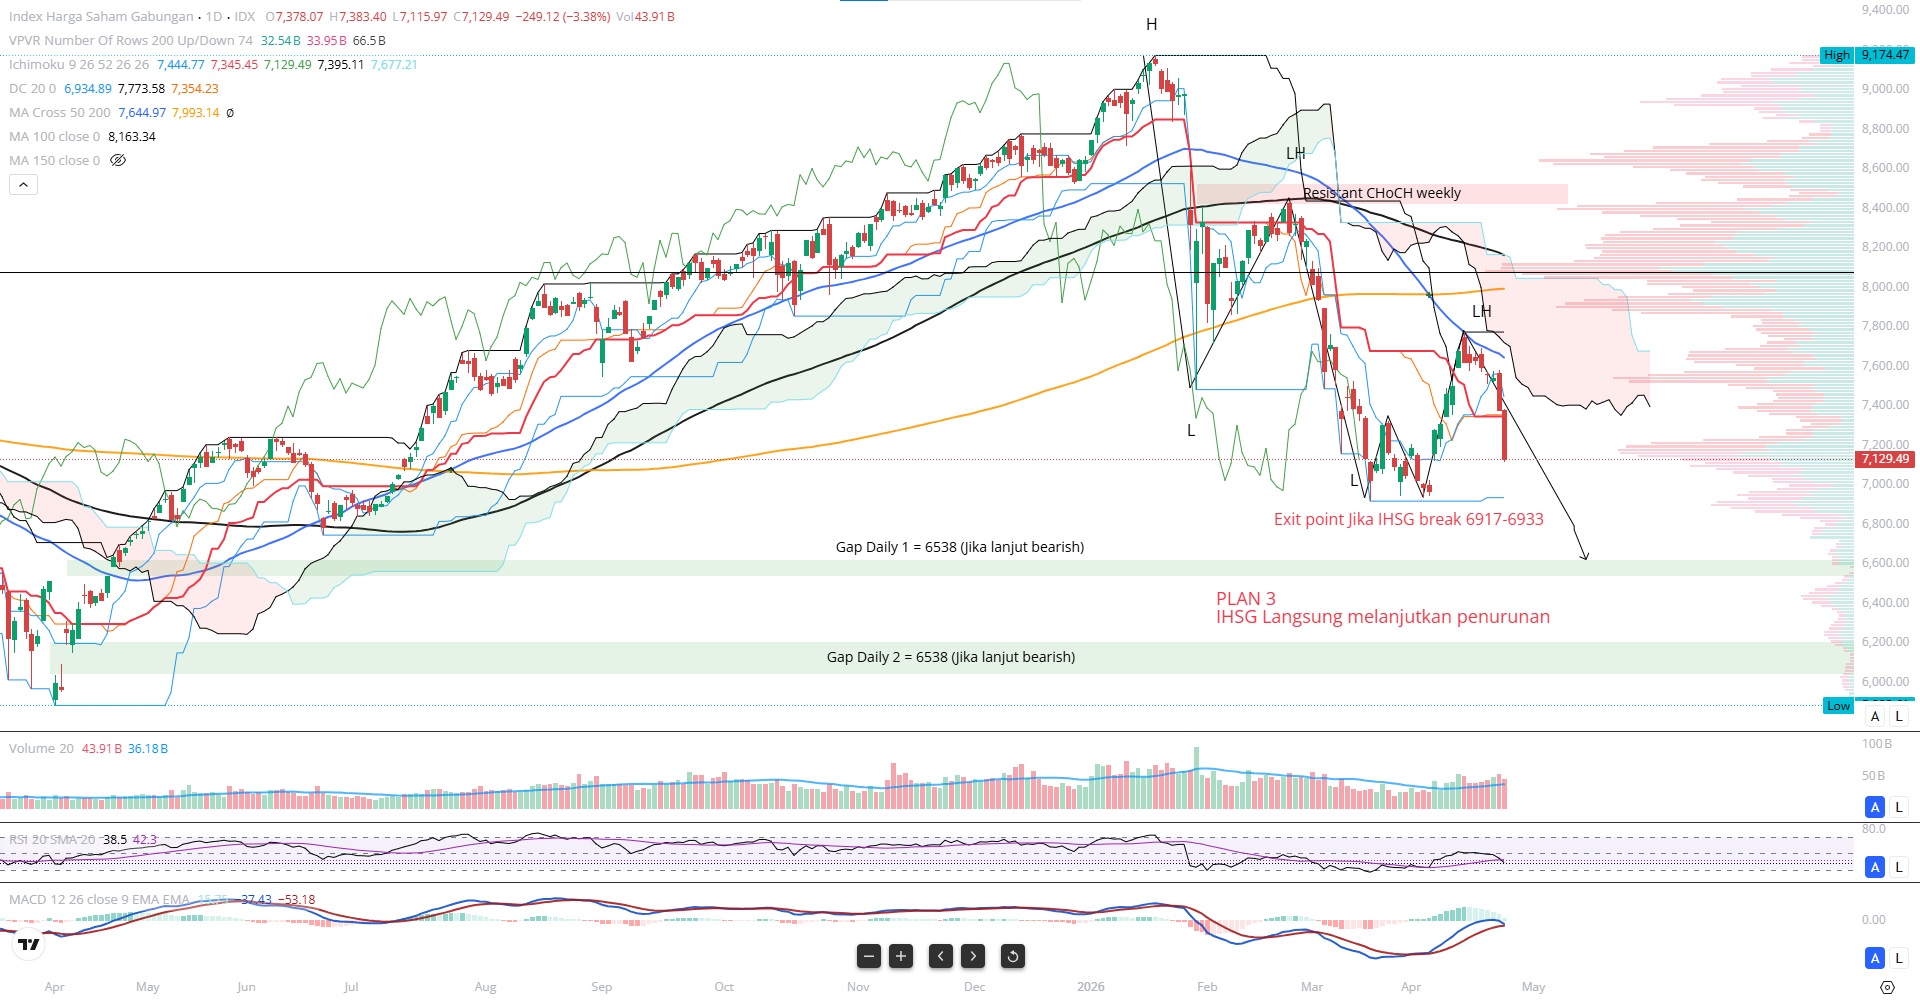
Plan 3 Untuk timeframe daily IHSG/Composite index langsung melanjutkan penurunan dan membuat new low (LL) setelah menutup gap di 7022 dan breakdown 6917 tidak ada perlawanan pada support terkuat 6917-7000.
Stoploss : 6917 (Exit atau no trade jika break dibawah 6917)
News for IHSG/Composite:https://jakartaglobe.id/business/bi-intervenes-as-rupiah-weakens-beyond-17300-to-historic-low
IHSG adalah singkatan dari Indeks Harga Saham Gabungan. IHSG juga dikenal dengan nama Indonesia Composite Index (ICI) atau IDX Composite. Secara sederhana, IHSG hanya angka yang indikator yang tidak bisa dibeli untuk menunjukan pergerakan harga seluruh saham yang tercatat di Bursa Efek Indonesia (BEI).Saat ini IHSG menarik dikarenakan sentimen internasional dan lokal.IHSG Mencapai puncak all time high pada 19 Januari 2026 di angka 9174 kemudian dump besar bersamaan dengan rilis MSCI yang akan menurunkan peringkat IHSG ke frontier market dikarenakan isu tata kelola governance BEI yang rapuh diantaranya Transparansi kepemilikan, freefloat serta penilaian institusi internasional memperparah kondisi penurunan IHSG. MSCI baru akan menentukan status kelas IHSG apakah Indonesia turun kasta ke frontier market atau tetap pada Emerging market di bulan mei 2026, selain itu diikuti penilaian institusi keuangan global lain FTSE, Fitchrating, Goldmansach, JPM dan diperparah pecahnya perang Iran-US-Israel.
Pada penutupan mingguan per 19 april 2026 IHSG mengalami kenaikan disertai dengan volume.
Perlu diperhatikan untuk timeframe weekly/mingguan, IHSG masih berada pada fase Bearish karena masih menunggu konfirmasi apakah menjadi higher low kemudian turun atau naik break 8440 untuk menjadi CHoCH (Change of Character).
Ketika Change of Character terjadi maka akan valid dikatakan bahwa IHSG ready to uptrend / bullish.
Daily Outlook :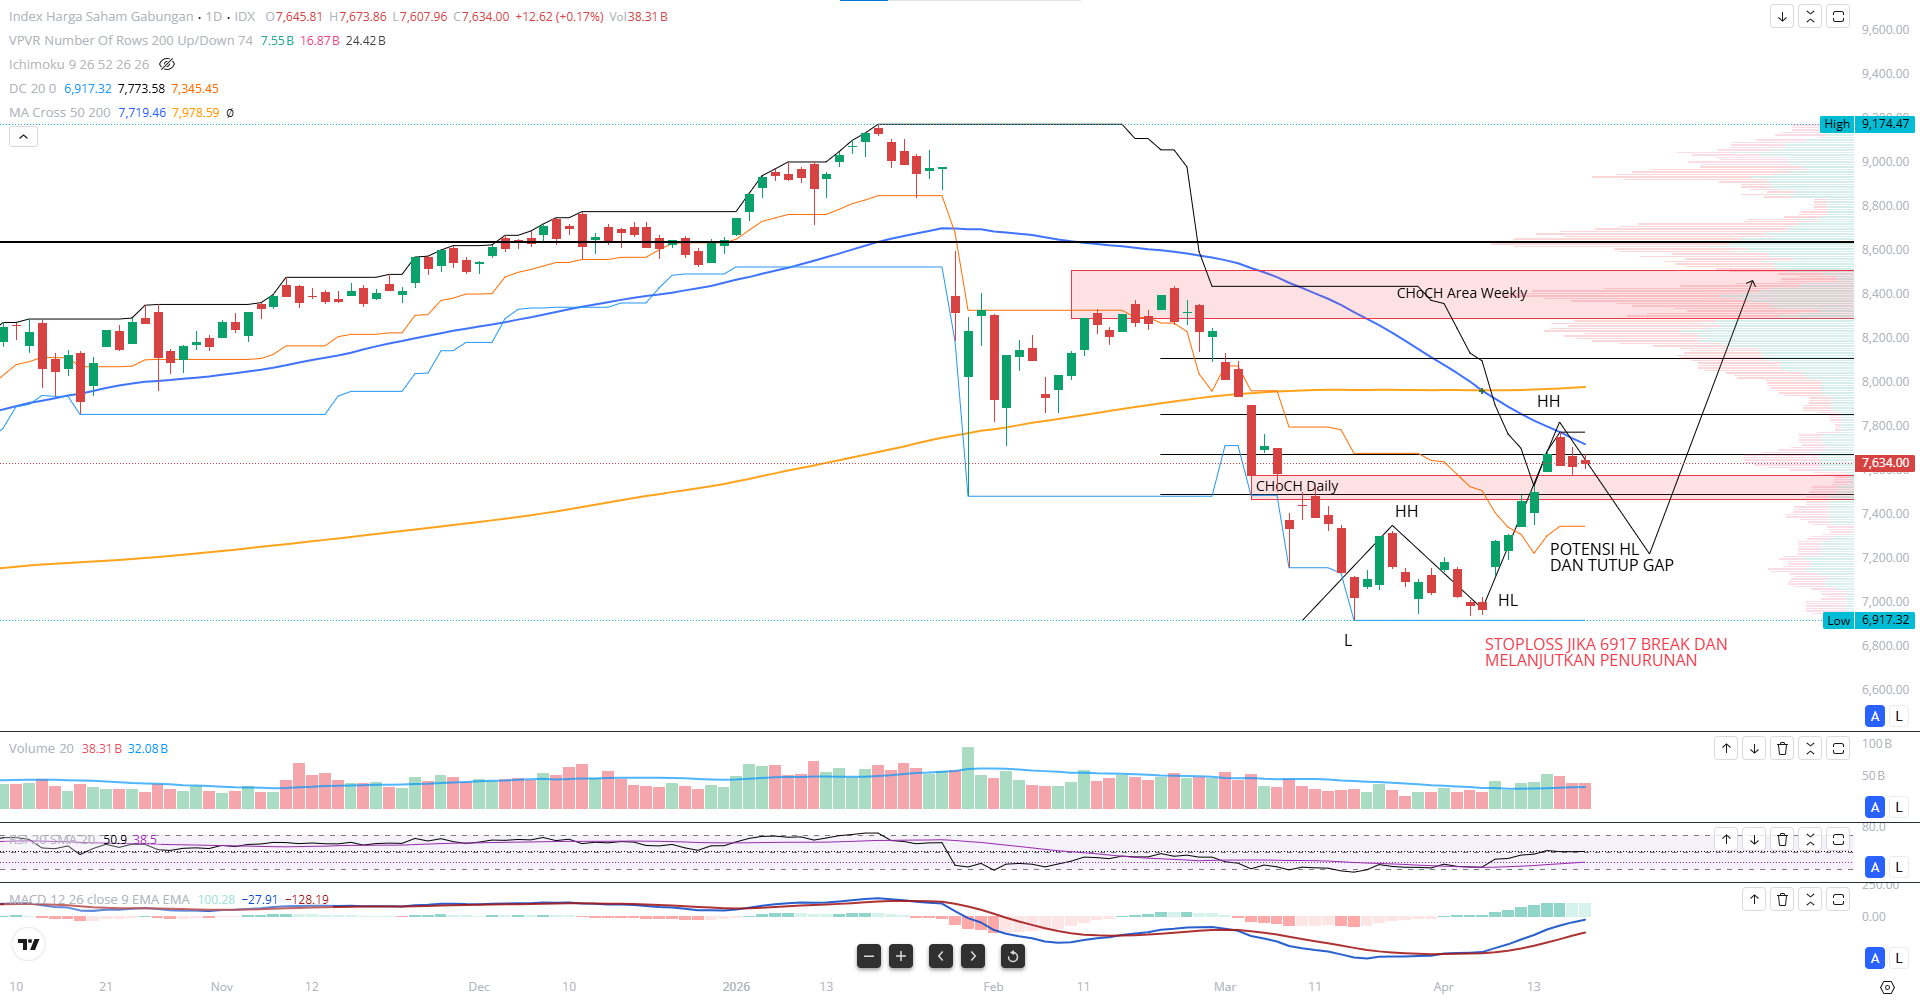
Untuk timeframe daily saat ini IHSG/Composite index masih berada pada posisi menentukan yaitu menjadi resis Lower high (LH) 0.618-0.786 fibo atau membuat new high diatas 8440 untuk memastikan bullish kembali/ fase Choch (change of Character) di timeframe weekly.
- Jika Ihsg breakdown terutama support 6917 breakdown maka IHSG akan melanjutkan potensi new low dengan support 6800 - 6000.
- Jika Ihsg mampu melanjutkan kenaikan hingga bertahan pada fase ChoCH weekly maka akan melanjutkan penguatan (bullish) 9000 keatas.
Posisi saat yang paling ideal 50% cash, 50% saham dengan trade cepat dan wajib memantau IHSG stoploss apabila IHSG Break 6917
Beberapa berita sangat berpengaruh terhadap Pergerakan IHSG :
- Selalu pantau perkembangan Perang Iran-US-Israel, terutama update buka-tutup Selat hormuz
- Update MSCI Mei 2026, Update peta besar rencana reformasi bursa efek oleh OJK-BEI
- Kondisi Kebijakan dalam negeri dan Perekonomian Indonesia terutama pergerakan kenaikan/penurunan USD-IDR
Intel Corporation is a American tech firm and a cornerstone of the global electronics industry, recognized for its massive capacity to manufacture the microchips that power modern computing.
For a long time, Intel stood as the primary leader in the personal computing sector. However, the landscape has shifted significantly. The company is now navigating a pivotal transformation as it faces aggressive rivalry from AMD, NVIDIA, TSMC, and other semiconductor company which currently leads the charge in the rapidly expanding AI hardware space.
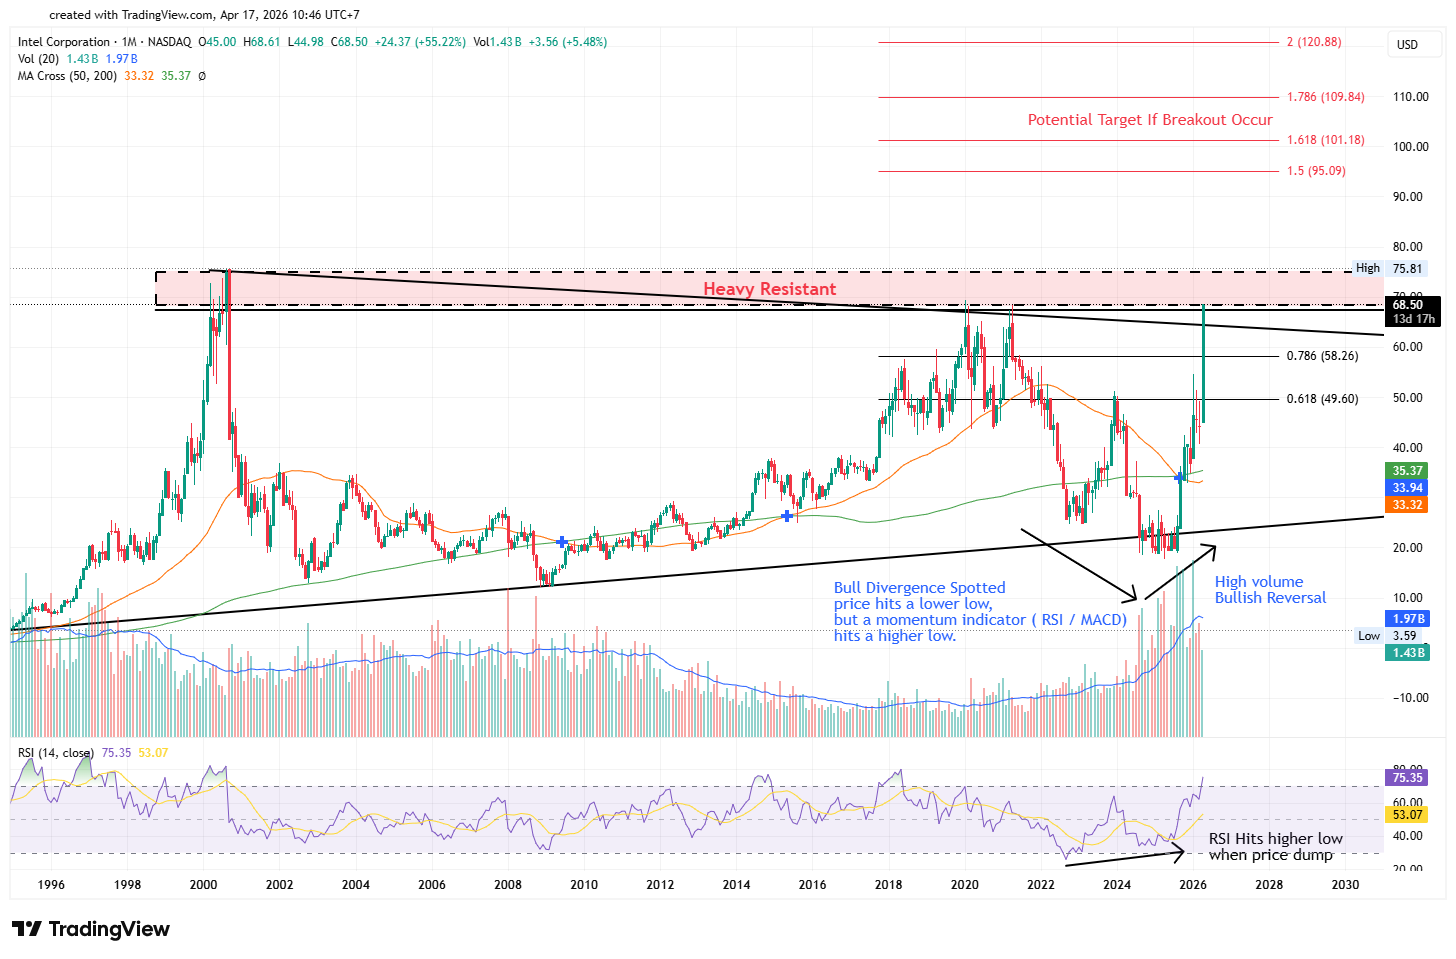
INTC is currently forming a bullish ascending triangle pattern. On the monthly timeframe (1M-3M), the stock exhibits strong bullish momentum as it approaches a major breakout point. Watchout for a decisive move above the critical resistance zone between $70-$75 USD.
Weekly Outlook :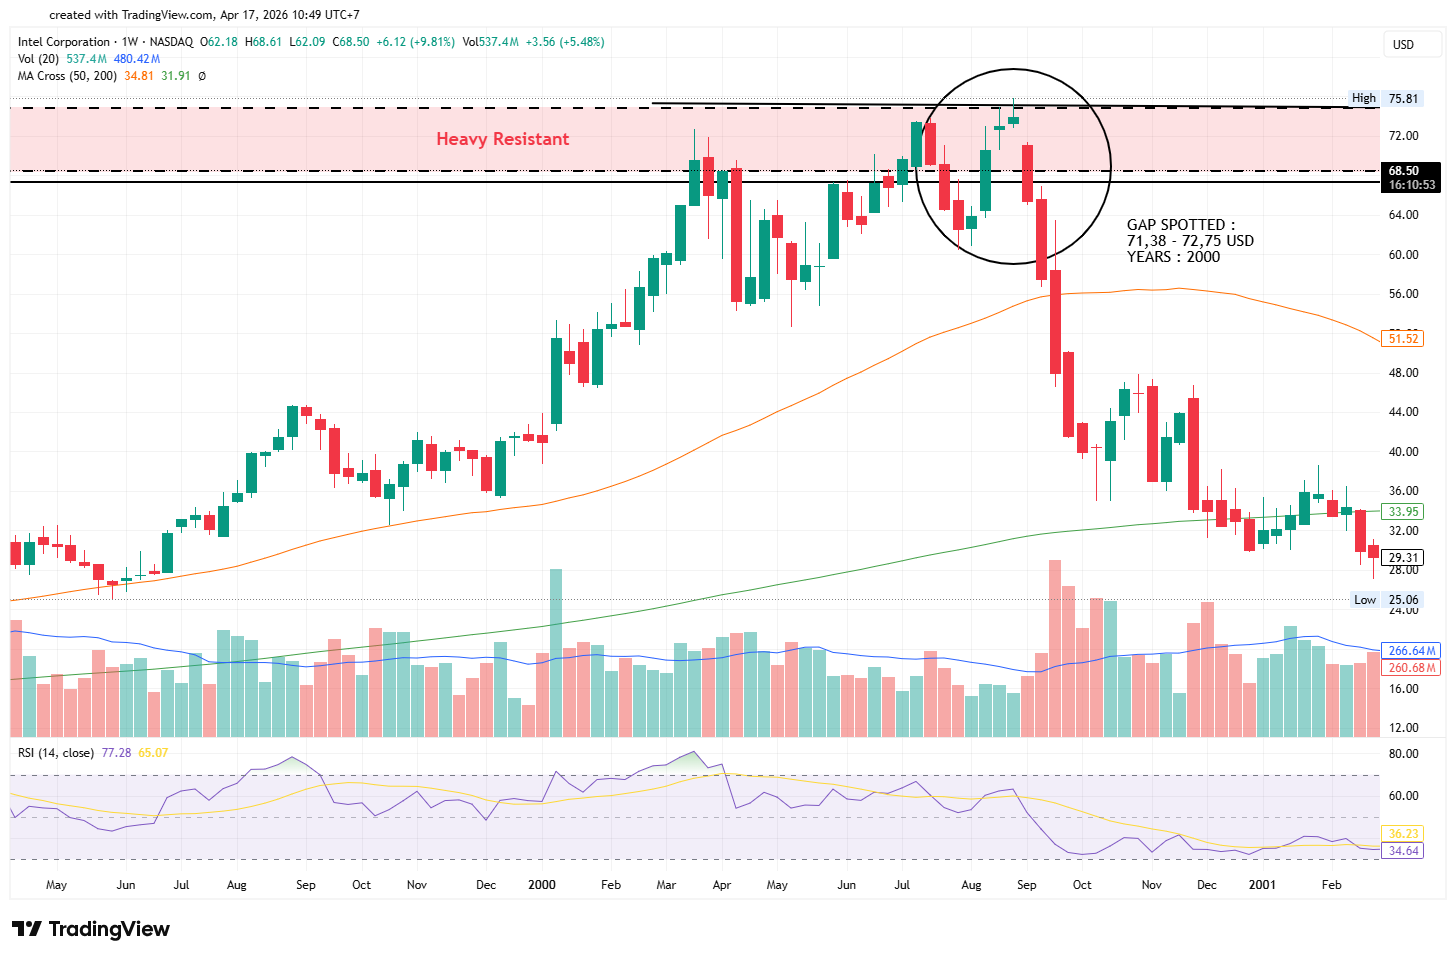
A long-standing weekly gap remains from the 2000 dot-com bubble. Not recommend to buy in this price, If INTC manages to close this gap and achieve a breakout supported by strong volume, the next bullish targets will be the Fibonacci extension levels of 1.5, 1.618, 1.786, and 2.0.
However, if the stock fails to break out and reach a new high, we expect a correction toward the immediate support levels between $58.26 and $49.60.
Good news for INTC Holder : ⚠️ Updated : 2026 May 28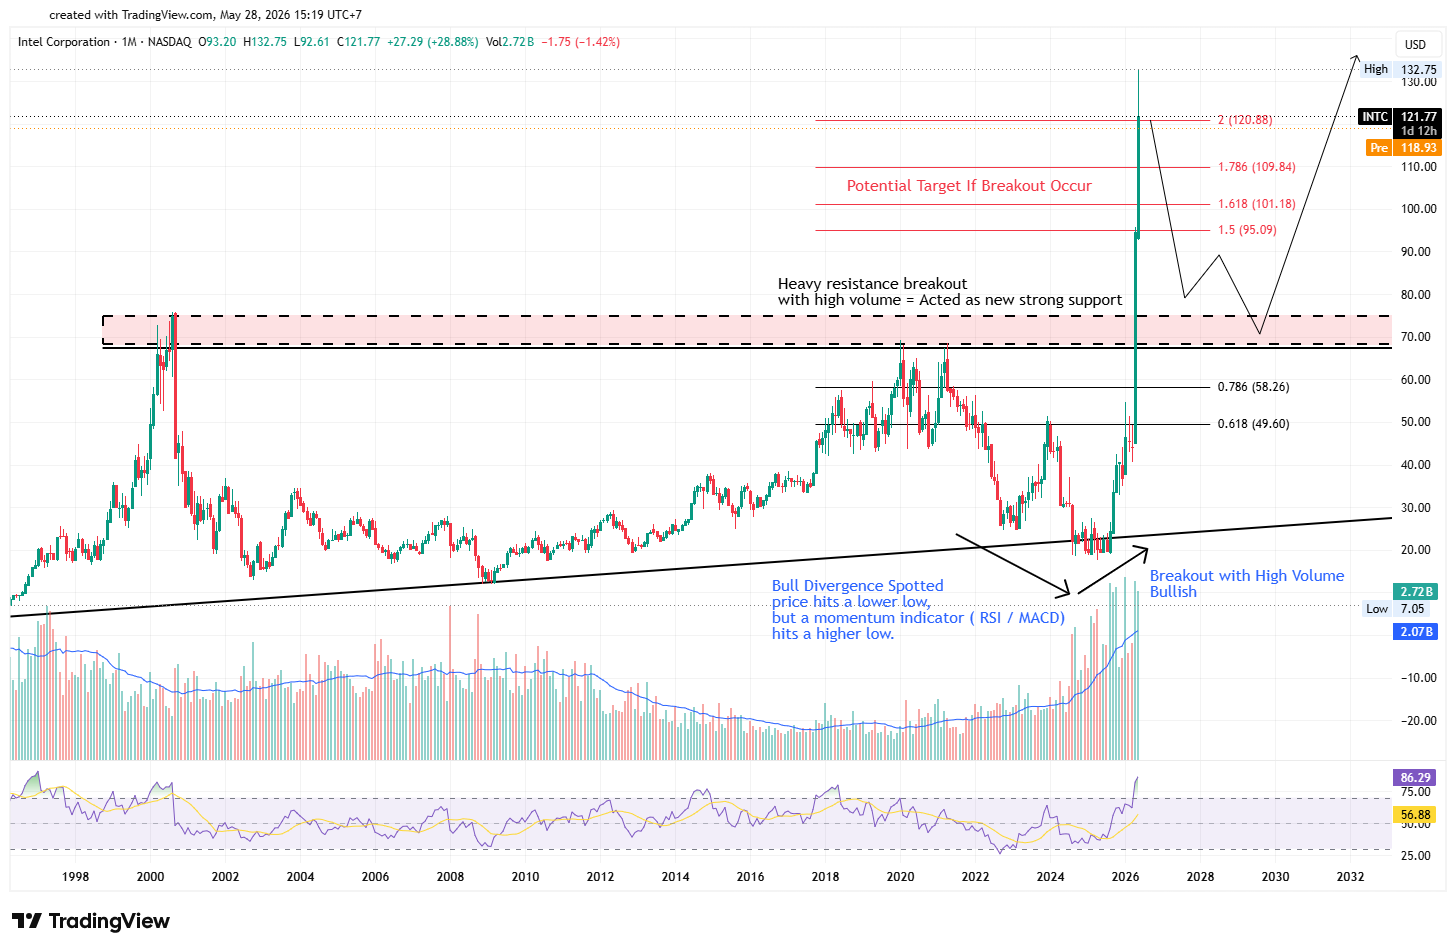
New Update 2026 may 28 : All Fibonacci extension levels of 1.5, 1.618, 1.786, 2.0 and gap in weekly have been hit. If you currently hold this stock, you may choose whether to partially unload your position or continue holding it. If you are looking to enter, wait for a clear price action confirmation on the weekly and monthly timeframes.
New Update 2026 may 28 : If the price goes down or falls with low volume on the weekly and monthly timeframes, that is usually considered a healthy correction. You can consider entering with a test buy on a breakout last resistance area at $75.81–$68 USD. Since there was a strong breakout with high volume, this resistance zone has now turned into support And remember always use a stop-loss of around 3.5% to 5% (depends on your risk) below that price area.
The hype around AI, semiconductors, and data centers is still strong. In addition, the Trump administration’s policies and strategic interest in Intel Corporation included the purchase of 433.3 million shares at $20.47 per share in August 2025, representing a 9.9% stake in the company. With INTC price surge $119.84 (may 21 2026), that investment is currently sitting on a profit of approximately 485%.
PT Salim Ivomas Pratama Tbk (SIMP) merupakan usaha agribisnis yang terintegrasi dengan bisnis utama CPO (Kelapa Sawit).PT Indofood Sukses Makmur (INDF) tergabung di Indonesia dan Indofood Agri Resources Ltd Singapura adalah induk dari usaha tersebut.
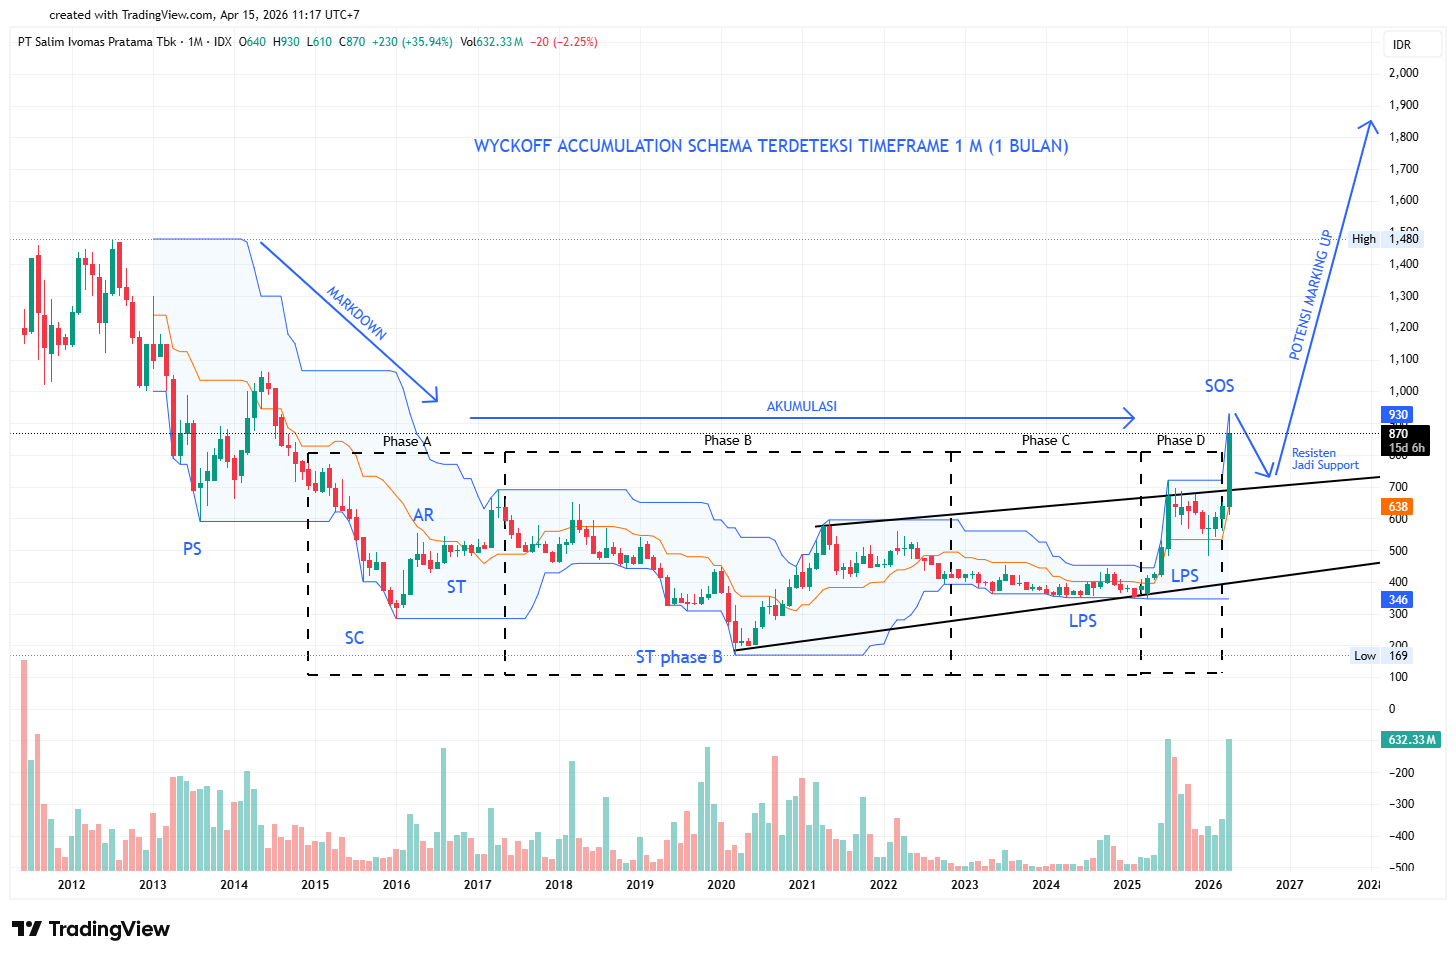
Wyckoff SIMP terdeteksi di timeframe monthly (1M), artinya pergerakannya membutuhkan waktu yang sangat lama estimasi 1-2 tahun. Untuk fase saat ini adalah phase D Menuju E (Marking Up Target estimasi 1285-1480++ new high)
Daily Outlook :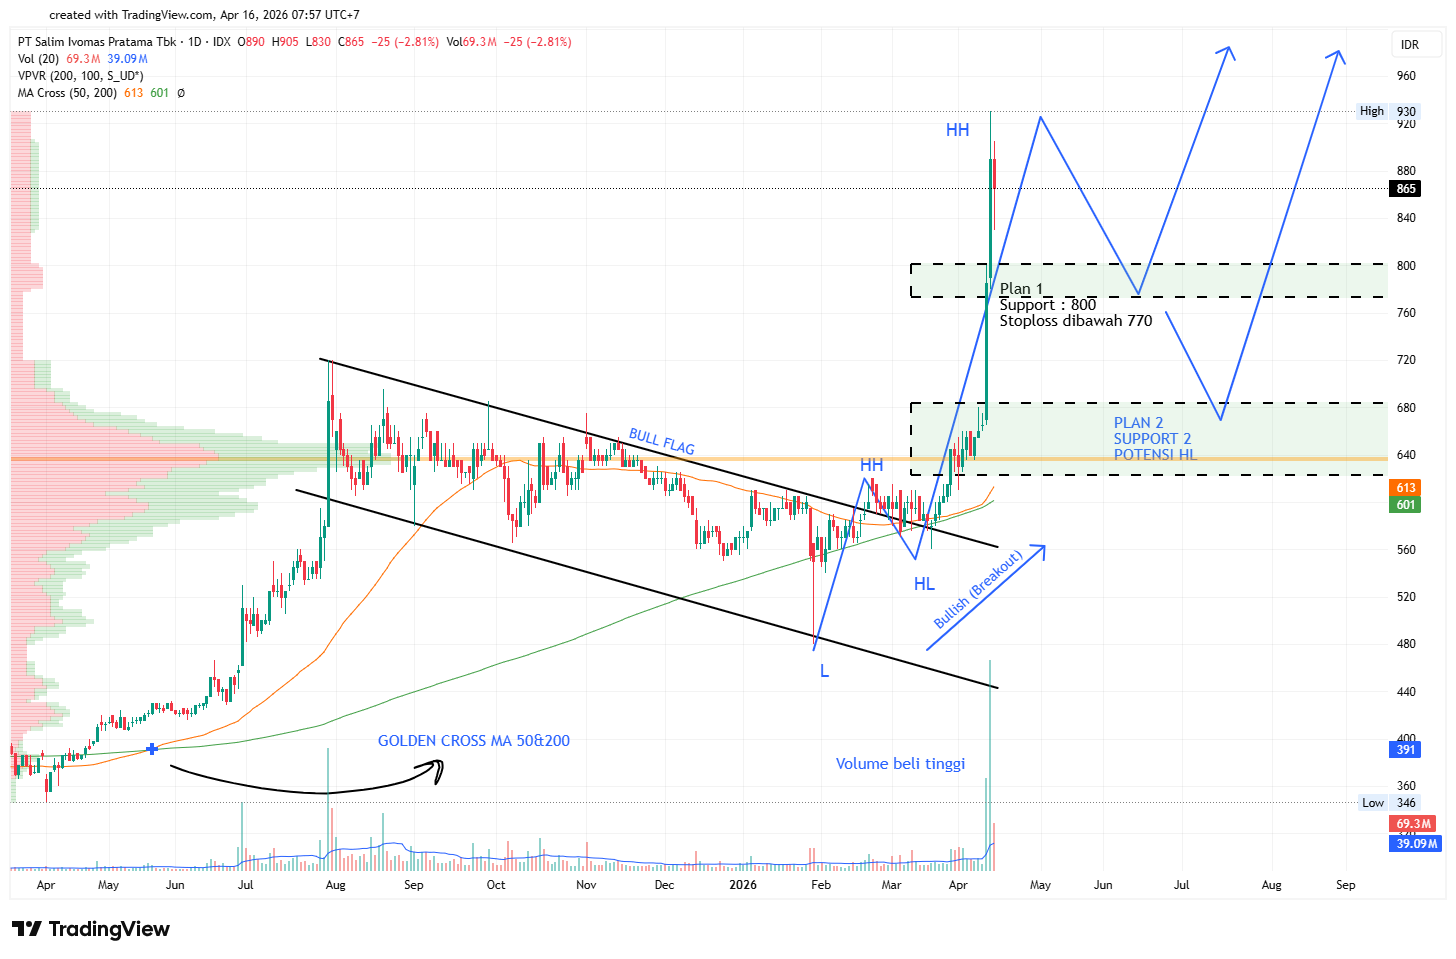
SIMP Breakout dengan volume yang cukup besar untuk timeframe 1D (Daily) Setelah melewati pattern bullish Falling wedge dan golden cross Selanjutnya akan menentukan (HL) kedua untuk melanjutkan pantulan Untuk reentry disarankan ada 2 area 1. Area 800 dengan stoploss ketat dibawah harga 770 2. Area 700-610 dengan stoploss dibawah harga 600.
Berita Positif Tentang Emiten SIMP:Emiten SIMP Mempunyai lini bisnis perkebunan kelapa sawit dan pengolahan CPO, Pemerintah Indonesia merilis kebijakan mandatory B50 (Pencampuran BBM dengan olahan CPO/Biosolar) Mulai 1 Juli 2026. B50 yang dikenal sebagai pencampuran 50% minyak kelapa sawit (CPO) dan 50% solar, Selain itu ditengah krisis Perang Selat hormuz Iran dan Israel-US yang menyebabkan pasokan Minyak terhambat
https://industri.kontan.co.id/news/pemerintah-terapkan-mandatori-b50-mulai-1-juli-2026